


It is very common to measure events with respect to time. The speed of a car, for example, can be calculated by dividing the distance traveled by the time it takes to travel that distance. Time-domain measurements, those events measured with respect to time, can be very useful to our understanding of the physical world and can be critical to building something that operates as intended. In electronics, time-domain measurements are extremely common. When a certain event occurs can be key to the success or failure of a design. Unfortunately, humans don’t have the ability to observe some elements of our world. Electrons are extremely useful but notoriously small and hard to catch. Luckily, we have been able to build tools that can help us observe electrons as they do their work. One such tool is the Oscilloscope.
Oscilloscopes are one of the most common tools used to perform time-domain measurements. In its simplest form, an oscilloscope plots a graph of the voltage at its input with respect to time.

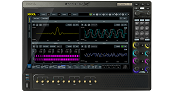
Figure 1: Oscilloscope display showing 2 waveforms. The horizontal axis of the display is showing time and the vertical axis is displaying amplitude. The upper waveform is sinusoidal and the lower waveform is a square wave. Note that they contain elements that repeat with respect to time.
In this way, an oscilloscope can show when events occur, measure the amplitude of the event, and also measure the time between events. When discussing time-varying events, we often use terms from basic wave theory. Let’s take a look at a common wave function, the sine wave, and describe these basic elements in more detail.
The sinusoidal wave (sine) is a time-varying waveform with smooth transitions that occurs quite frequently in electronics.
The sine wave is mathematically represented as:
y(t) = A*sin(2πft + )
Where A is the amplitude, f is the frequency of oscillations (cycles) that occur per unit of time, and, the phase, specifies (in radians) wherein its cycle of the oscillation.
The period of a time-varying signal is the smallest amount of time that defines a fundamental repeating element of the waveform. The waveform in Figure 2 is a Sinusoidal waveform showing the amplitude and one period of the waveform.
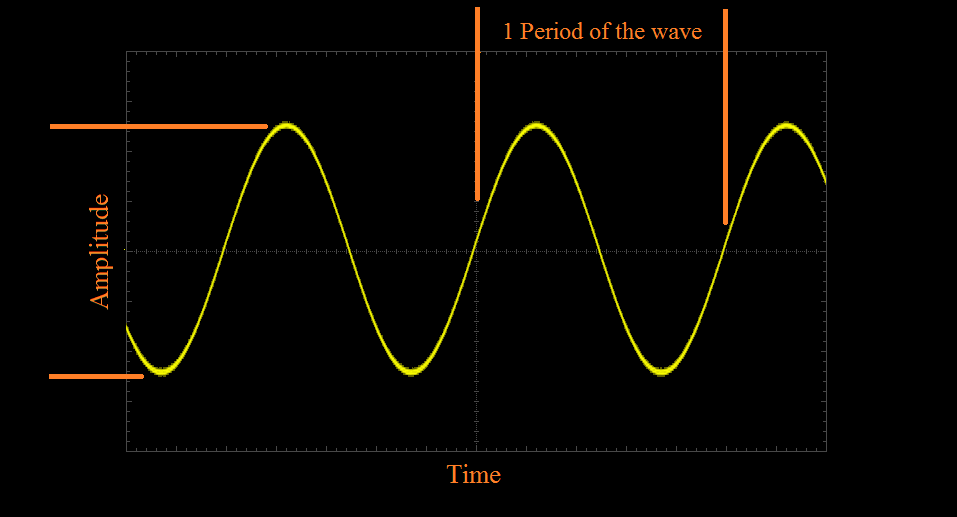
Figure 2: Sinusoidal waveform with common waveform terminology.
The frequency is the number of such periods that occur during an amount of time. Time and frequency are linked by the equation below:
f = 1/T
Where f is the frequency in Hertz (Hz) and T is the waveform period in seconds. Hertz is a secondary unit that represents the inverse of the waveform period (1/s).
Let’s look at the voltage from our wall outlet again. If we measured the wall voltage with an oscilloscope, we would see that it has an amplitude of approximately 110V and a period of 16.67ms. This means that every 16.67ms, the voltage values repeat.
What is the frequency of the wall voltage waveform?
f = 1/T = 1/16.67ms = 60Hz
So, that’s the whole basic story that talks about the time domain measurement on the oscilloscope.
About RIGOL Technologies:
RIGOL Technologies is transforming the Test and Measurement Industry. Our premium line of products includes Digital and Mixed Signal Oscilloscopes, Spectrum Analyzers, Function/Arbitrary Waveform Generators, Programmable Power Supplies, Digital Multimeters, and Data Acquisition Systems. Our test solutions combine uncompromised product performance, quality, and advanced product features; all delivered at extremely attractive price points. This combination provides our customers with unprecedented value for their investment, reduces their overall cost of test, and helps speed time to completion of their designs or projects.
Find the latest promotion of Oscilloscope here: Promotion