


In the rapidly evolving world of RF and microwave communications—spanning from mobile phones and IoT devices to automotive and high-frequency wireless systems—network analyzers play a vital role. Their importance stems from their ability to verify and characterize not just individual components but entire subsystems, ensuring optimized performance in complex electrical environments.
1. The Basics of Network Analysis
A network analyzer is a cornerstone instrument for RF engineering, used to measure key parameters like S-parameters (scattering parameters) and impedance. It supports testing both passive (such as transmission lines, waveguides, and resonators) and active components (like amplifiers and mixers), covering the full spectrum of RF/microwave systems.
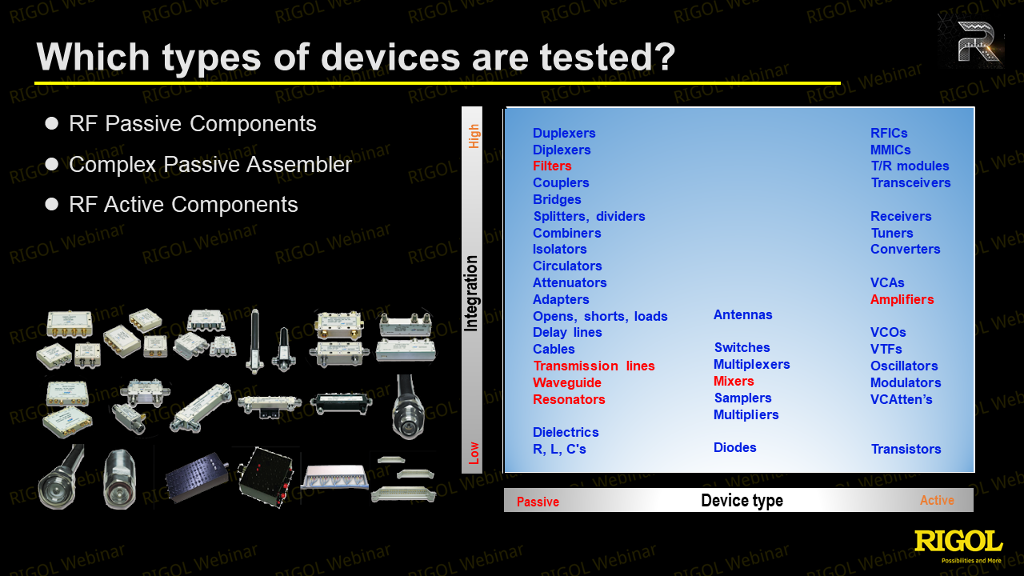
Figure 1 Which Types of Devices are Tested
Like any network, an electrical network's performance depends on both transmission and reflection behaviors. Network analyzers measure these parameters, helping ensure high-quality performance, particularly in high-frequency environments such as millimeter wave (30 GHz to several hundred GHz) and future 6G communications.
2. Scalar vs. Vector Network Analyzers
There are two fundamental types of network analyzers: scalar and vector. Scalar types measure magnitude-related parameters (like power or loss), but lack phase information. In contrast, vector network analyzers (VNAs) capture both magnitude and phase, enabling deeper analysis—such as impedance matching using Smith charts, group delay, and phase delay.
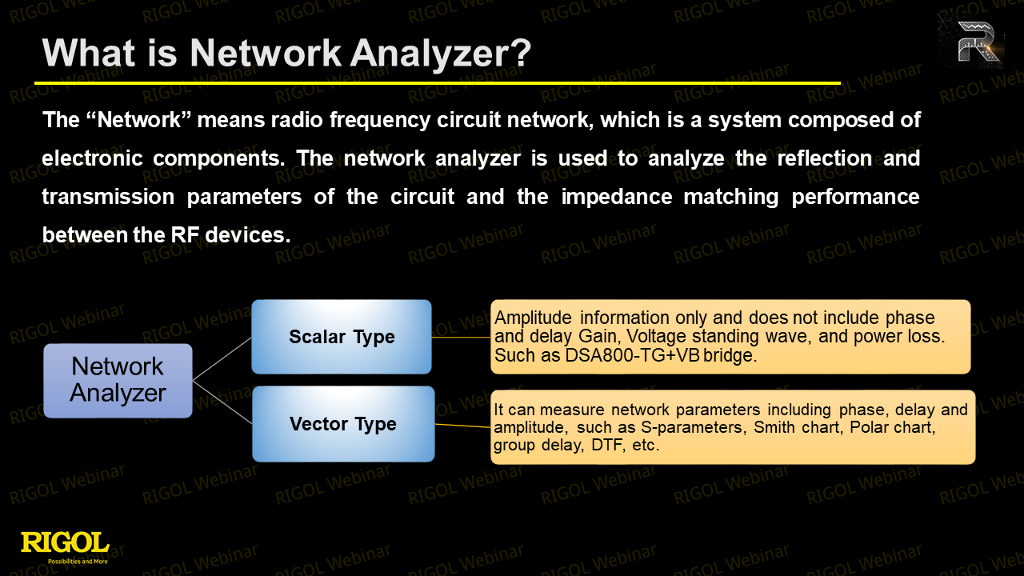
Figure 2 What is Network Analyzer
VNAs operate mainly in the frequency domain but can also perform time-domain analysis (e.g., Time Domain Reflectometry, TDR) by using mathematical transforms (inverse Fourier). This helps identify issues like faults or discontinuities in cables and transmission lines.
3. S-Parameters and the Smith Chart (Impedance Chart)
S-parameters are central to network analysis, describing how energy travels through a device under test (DUT). Commonly measured parameters include S11, S21, S12, and S22. These are typically represented as a matrix and are foundational for understanding RF behavior.
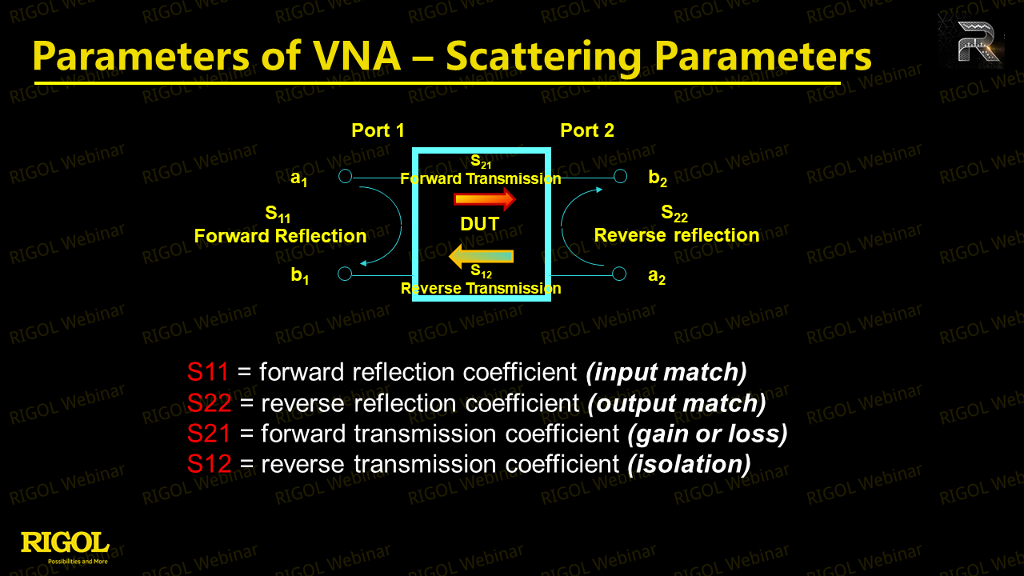
Figure 3 Parameters of VNA – Scattering Parameters
The Smith chart (a.k.a. Impedance Chart) is a powerful graphical tool used to visualize impedance matching, including conditions such as short, open, and matched circuits, as well as reflection coefficients. By plotting measurement data on a Smith chart, engineers can quickly assess matching status and infer whether a circuit is inductive or capacitive reactance—aiding efficient design and troubleshooting.
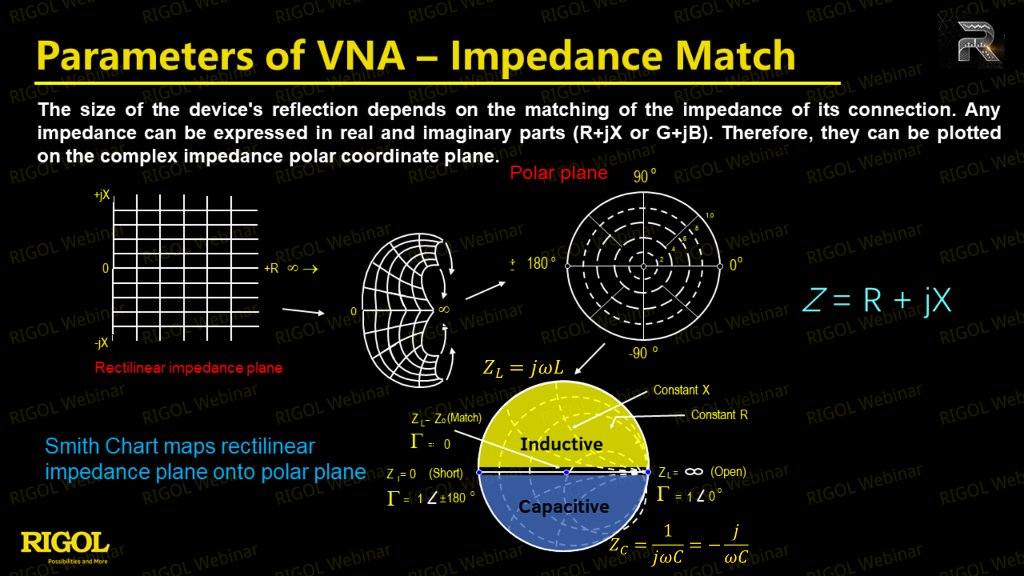
Figure 4 Parameter of VNA - Impedance Match (Smith Chart)
4. Calibration and Port Extension
Accurate network analysis demands careful calibration—typically using open, short, and load standards—to account for unwanted effects and ensure the reference plane aligns with the DUT. Without proper calibration, measurement results may be skewed.
Port extension is a crucial methodology when it's impractical to directly connect a DUT to the analyzer—often due to device size or test setup constraints. Extension cables are used, and their effects (such as added delay or inductance) must be considered in calibration. Entering correct parameters, especially the velocity factor of cables, is essential to avoid erroneous results. For example, with SMB cables using Teflon dielectrics, the velocity factor might be around 0.66, and inaccuracies here can disrupt all subsequent measurements and Smith chart interpretations.

Figure 5 How to Define the Traveling Wave Parameters
5. Practical Testing Workflow
A typical test might involve connecting the analyzer to an antenna via SMA extension cables, setting the frequency sweep range (e.g., 100 MHz to 4 GHz for a 2.4 GHz antenna), and selecting an appropriate number of sweep points for accuracy. Calibration is performed with open, short, and load kits; only after completing all three can reliable VNA results be achieved. Once calibrated, the DUT is connected, measurements like VSWR (Voltage Standing Wave Ratio), resonant frequency, and reflection coefficients are taken, and insights are visualized using Smith charts.
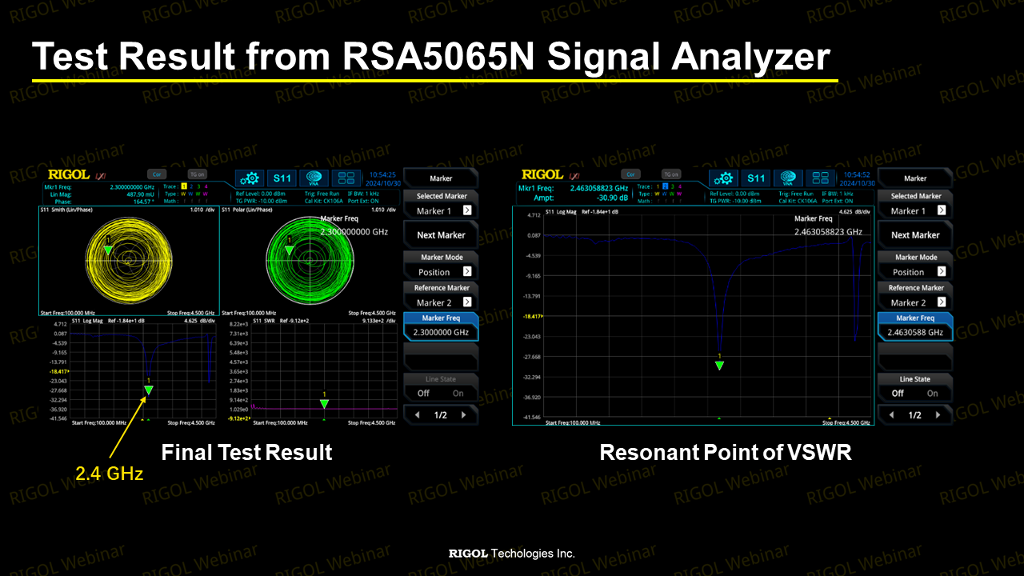
Figure 6 Test Result
The Smith Chart on the left test result shows a long transmission path, as indicated by the lengthy cable. The resonant point occurs at 2.4 GHz, which matches the designed frequency of the tested antenna. Additionally, the VSWR was also measured at this frequency.
Conclusion
Network analyzers are essential tools for ensuring optimal performance and reliability in RF and microwave systems. Understanding their operation, the significance of S-parameters, calibration, and the correct application of port extension techniques are foundational for engineers and technicians in this field. As communication technologies advance toward 6G and beyond, the meticulous use of network analysis will remain critical for innovation and quality assurance.
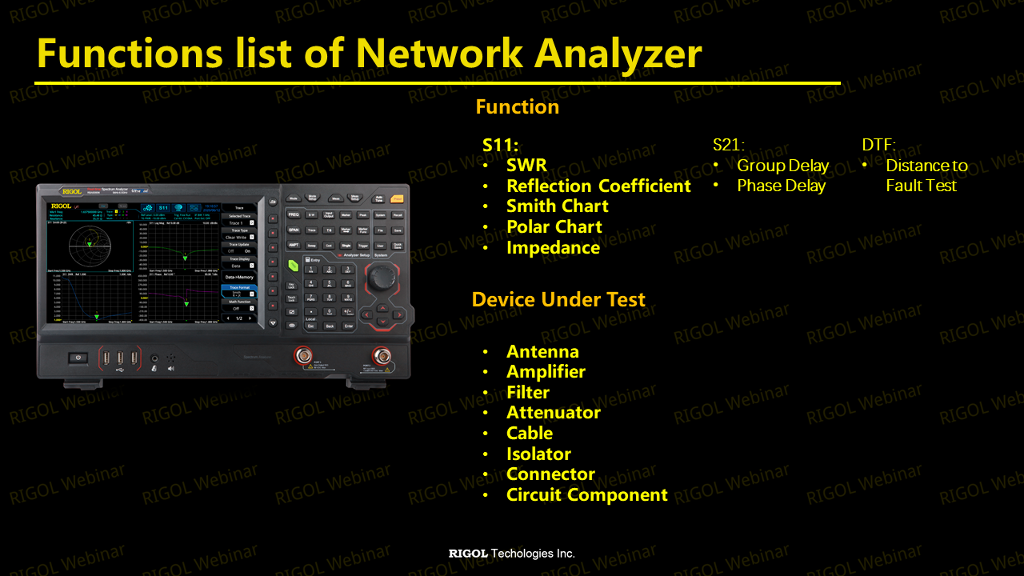
Figure 7 RSA5000N Function List